
 Stephanie Ferguson Melhorn
Executive Director, Workforce & International Labor Policy, U.S. Chamber of Commerce
Published
November 03, 2023
The state of Kentucky has a favorable landscape for businesses and individuals, with a diverse economy, significant labor market recovery, and a robust small business ecosystem. Educational attainment, quality of life, and cost of living factors remain promising.
The Worker Shortage Across America
Explore the interactive map below to see the impact of the worker shortage crisis in each state.
Alabama
-
0.73
Alabama's Worker Shortage Index
- Job Openings: 108,000
- Unemployed Workers: 78,740
- Labor Force Participation Rate: 57.9%
- Unemployment Rate: 3.3%
- Quit Rate: 2.2%
- Hiring Rate: 3.6%
Alaska
-
0.85
Alaska's Worker Shortage Index
- Job Openings: 20,000
- Unemployed Workers: 17,067
- Labor Force Participation Rate: 65.2%
- Unemployment Rate: 4.7%
- Quit Rate: 2.7%
- Hiring Rate: 5.3%
Arizona
-
0.90
Arizona's Worker Shortage Index
- Job Openings: 170,000
- Unemployed Workers: 153,827
- Labor Force Participation Rate: 61.5%
- Unemployment Rate: 4.1%
- Quit Rate: 2.0%
- Hiring Rate: 3.6%
Arkansas
-
0.69
Arkansas's Worker Shortage Index
- Job Openings: 76,000
- Unemployed Workers: 52,230
- Labor Force Participation Rate: 58.4%
- Unemployment Rate: 3.7%
- Quit Rate: 2.3%
- Hiring Rate: 3.8%
California
-
1.60
California's Worker Shortage Index
- Job Openings: 659,000
- Unemployed Workers: 1,054,992
- Labor Force Participation Rate: 62.2%
- Unemployment Rate: 5.3%
- Quit Rate: 2.0%
- Hiring Rate: 2.8%
Colorado
-
1.09
Colorado's Worker Shortage Index
- Job Openings: 145,000
- Unemployed Workers: 158,688
- Labor Force Participation Rate: 67.8%
- Unemployment Rate: 4.8%
- Quit Rate: 2.1%
- Hiring Rate: 4.5%
Connecticut
-
0.99
Connecticut's Worker Shortage Index
- Job Openings: 73,000
- Unemployed Workers: 72,232
- Labor Force Participation Rate: 65.0%
- Unemployment Rate: 3.7%
- Quit Rate: 2.1%
- Hiring Rate: 3.1%
Delaware
-
0.89
Delaware's Worker Shortage Index
- Job Openings: 22,000
- Unemployed Workers: 19,598
- Labor Force Participation Rate: 58.9%
- Unemployment Rate: 3.9%
- Quit Rate: 2.2%
- Hiring Rate: 3.6%
District of Columbia
-
0.90
District of Columbia's Worker Shortage Index
- Job Openings: 27,000
- Unemployed Workers: 24,409
- Labor Force Participation Rate: 72.4%
- Unemployment Rate: 5.8%
- Quit Rate: 1.8%
- Hiring Rate: 2.3%
Florida
-
0.95
Florida's Worker Shortage Index
- Job Openings: 433,000
- Unemployed Workers: 410,460
- Labor Force Participation Rate: 58.0%
- Unemployment Rate: 3.7%
- Quit Rate: 2.4%
- Hiring Rate: 3.5%
Georgia
-
0.72
Georgia's Worker Shortage Index
- Job Openings: 266,000
- Unemployed Workers: 191,739
- Labor Force Participation Rate: 60.8%
- Unemployment Rate: 3.6%
- Quit Rate: 2.2%
- Hiring Rate: 3.7%
Hawaii
-
0.79
Hawaii's Worker Shortage Index
- Job Openings: 25,000
- Unemployed Workers: 19,655
- Labor Force Participation Rate: 60.5%
- Unemployment Rate: 2.9%
- Quit Rate: 1.8%
- Hiring Rate: 3.2%
Idaho
-
0.87
Idaho's Worker Shortage Index
- Job Openings: 43,000
- Unemployed Workers: 37,300
- Labor Force Participation Rate: 63.6%
- Unemployment Rate: 3.7%
- Quit Rate: 2.6%
- Hiring Rate: 4.4%
Illinois
-
1.11
Illinois's Worker Shortage Index
- Job Openings: 291,000
- Unemployed Workers: 321,693
- Labor Force Participation Rate: 64.9%
- Unemployment Rate: 4.8%
- Quit Rate: 2.4%
- Hiring Rate: 3.2%
Indiana
-
0.88
Indiana's Worker Shortage Index
- Job Openings: 153,000
- Unemployed Workers: 134,329
- Labor Force Participation Rate: 63.7%
- Unemployment Rate: 3.9%
- Quit Rate: 2.9%
- Hiring Rate: 4.6%
Iowa
-
0.90
Iowa's Worker Shortage Index
- Job Openings: 67,000
- Unemployed Workers: 60,570
- Labor Force Participation Rate: 67.2%
- Unemployment Rate: 3.5%
- Quit Rate: 2.6%
- Hiring Rate: 3.5%
Kansas
-
0.82
Kansas's Worker Shortage Index
- Job Openings: 73,000
- Unemployed Workers: 59,664
- Labor Force Participation Rate: 67.1%
- Unemployment Rate: 3.8%
- Quit Rate: 2.4%
- Hiring Rate: 3.4%
Kentucky
-
1.08
Kentucky's Worker Shortage Index
- Job Openings: 101,000
- Unemployed Workers: 109,315
- Labor Force Participation Rate: 58.4%
- Unemployment Rate: 5.2%
- Quit Rate: 2.0%
- Hiring Rate: 3.6%
Louisiana
-
0.93
Louisiana's Worker Shortage Index
- Job Openings: 98,000
- Unemployed Workers: 91,053
- Labor Force Participation Rate: 57.9%
- Unemployment Rate: 4.4%
- Quit Rate: 2.3%
- Hiring Rate: 3.9%
Maine
-
0.88
Maine's Worker Shortage Index
- Job Openings: 28,000
- Unemployed Workers: 24,509
- Labor Force Participation Rate: 60.1%
- Unemployment Rate: 3.5%
- Quit Rate: 2.3%
- Hiring Rate: 3.6%
Maryland
-
0.76
Maryland's Worker Shortage Index
- Job Openings: 133,000
- Unemployed Workers: 100,476
- Labor Force Participation Rate: 64.8%
- Unemployment Rate: 3.1%
- Quit Rate: 2.1%
- Hiring Rate: 3.2%
Massachusetts
-
1.22
Massachusetts's Worker Shortage Index
- Job Openings: 148,000
- Unemployed Workers: 180,846
- Labor Force Participation Rate: 66.7%
- Unemployment Rate: 4.6%
- Quit Rate: 1.8%
- Hiring Rate: 3.2%
Michigan
-
1.24
Michigan's Worker Shortage Index
- Job Openings: 225,000
- Unemployed Workers: 277,879
- Labor Force Participation Rate: 62.0%
- Unemployment Rate: 5.5%
- Quit Rate: 2.1%
- Hiring Rate: 4.5%
Minnesota
-
0.53
Minnesota's Worker Shortage Index
- Job Openings: 187,000
- Unemployed Workers: 100,039
- Labor Force Participation Rate: 68.2%
- Unemployment Rate: 3.2%
- Quit Rate: 2.1%
- Hiring Rate: 3.5%
Mississippi
-
0.85
Mississippi's Worker Shortage Index
- Job Openings: 61,000
- Unemployed Workers: 52,084
- Labor Force Participation Rate: 56.2%
- Unemployment Rate: 4.0%
- Quit Rate: 2.1%
- Hiring Rate: 3.5%
Missouri
-
0.86
Missouri's Worker Shortage Index
- Job Openings: 145,000
- Unemployed Workers: 124,132
- Labor Force Participation Rate: 63.4%
- Unemployment Rate: 3.9%
- Quit Rate: 2.1%
- Hiring Rate: 3.1%
Montana
-
0.54
Montana's Worker Shortage Index
- Job Openings: 29,000
- Unemployed Workers: 15,697
- Labor Force Participation Rate: 62.3%
- Unemployment Rate: 2.7%
- Quit Rate: 3.0%
- Hiring Rate: 4.9%
Nebraska
-
0.66
Nebraska's Worker Shortage Index
- Job Openings: 49,000
- Unemployed Workers: 32,249
- Labor Force Participation Rate: 69.3%
- Unemployment Rate: 3.0%
- Quit Rate: 2.1%
- Hiring Rate: 3.6%
Nevada
-
1.38
Nevada's Worker Shortage Index
- Job Openings: 68,000
- Unemployed Workers: 93,534
- Labor Force Participation Rate: 62.9%
- Unemployment Rate: 5.6%
- Quit Rate: 2.1%
- Hiring Rate: 3.8%
New Hampshire
-
0.83
New Hampshire's Worker Shortage Index
- Job Openings: 29,000
- Unemployed Workers: 24,170
- Labor Force Participation Rate: 65.7%
- Unemployment Rate: 3.1%
- Quit Rate: 2.0%
- Hiring Rate: 3.4%
New Jersey
-
1.10
New Jersey's Worker Shortage Index
- Job Openings: 213,000
- Unemployed Workers: 234,394
- Labor Force Participation Rate: 63.9%
- Unemployment Rate: 4.8%
- Quit Rate: 1.7%
- Hiring Rate: 3.5%
New Mexico
-
0.96
New Mexico's Worker Shortage Index
- Job Openings: 44,000
- Unemployed Workers: 42,131
- Labor Force Participation Rate: 57.8%
- Unemployment Rate: 4.3%
- Quit Rate: 2.1%
- Hiring Rate: 3.4%
New York
-
0.95
New York's Worker Shortage Index
- Job Openings: 430,000
- Unemployed Workers: 410,366
- Labor Force Participation Rate: 61.0%
- Unemployment Rate: 4.2%
- Quit Rate: 1.5%
- Hiring Rate: 2.8%
North Carolina
-
0.77
North Carolina's Worker Shortage Index
- Job Openings: 255,000
- Unemployed Workers: 196,360
- Labor Force Participation Rate: 59.6%
- Unemployment Rate: 3.7%
- Quit Rate: 2.0%
- Hiring Rate: 3.0%
North Dakota
-
0.46
North Dakota's Worker Shortage Index
- Job Openings: 24,000
- Unemployed Workers: 11,009
- Labor Force Participation Rate: 69.5%
- Unemployment Rate: 2.6%
- Quit Rate: 2.4%
- Hiring Rate: 3.8%
Ohio
-
0.98
Ohio's Worker Shortage Index
- Job Openings: 296,000
- Unemployed Workers: 291,306
- Labor Force Participation Rate: 62.7%
- Unemployment Rate: 4.9%
- Quit Rate: 2.2%
- Hiring Rate: 3.4%
Oklahoma
-
0.69
Oklahoma's Worker Shortage Index
- Job Openings: 93,000
- Unemployed Workers: 64,249
- Labor Force Participation Rate: 62.6%
- Unemployment Rate: 3.2%
- Quit Rate: 2.3%
- Hiring Rate: 3.6%
Oregon
-
1.12
Oregon's Worker Shortage Index
- Job Openings: 92,000
- Unemployed Workers: 103,325
- Labor Force Participation Rate: 62.7%
- Unemployment Rate: 4.7%
- Quit Rate: 2.1%
- Hiring Rate: 3.3%
Pennsylvania
-
0.96
Pennsylvania's Worker Shortage Index
- Job Openings: 265,000
- Unemployed Workers: 255,589
- Labor Force Participation Rate: 61.6%
- Unemployment Rate: 3.9%
- Quit Rate: 1.5%
- Hiring Rate: 2.7%
Rhode Island
-
1.31
Rhode Island's Worker Shortage Index
- Job Openings: 22,000
- Unemployed Workers: 28,829
- Labor Force Participation Rate: 63.8%
- Unemployment Rate: 4.9%
- Quit Rate: 2.1%
- Hiring Rate: 3.5%
South Carolina
-
0.91
South Carolina's Worker Shortage Index
- Job Openings: 117,000
- Unemployed Workers: 106,498
- Labor Force Participation Rate: 57.5%
- Unemployment Rate: 4.2%
- Quit Rate: 2.3%
- Hiring Rate: 4.0%
South Dakota
-
0.41
South Dakota's Worker Shortage Index
- Job Openings: 22,000
- Unemployed Workers: 9,049
- Labor Force Participation Rate: 68.9%
- Unemployment Rate: 1.8%
- Quit Rate: 2.8%
- Hiring Rate: 3.8%
Tennessee
-
0.73
Tennessee's Worker Shortage Index
- Job Openings: 167,000
- Unemployed Workers: 122,290
- Labor Force Participation Rate: 59.7%
- Unemployment Rate: 3.5%
- Quit Rate: 2.3%
- Hiring Rate: 3.7%
Texas
-
1.15
Texas's Worker Shortage Index
- Job Openings: 558,000
- Unemployed Workers: 642,922
- Labor Force Participation Rate: 64.9%
- Unemployment Rate: 4.1%
- Quit Rate: 2.3%
- Hiring Rate: 3.7%
Utah
-
0.76
Utah's Worker Shortage Index
- Job Openings: 76,000
- Unemployed Workers: 57,518
- Labor Force Participation Rate: 68.3%
- Unemployment Rate: 3.1%
- Quit Rate: 2.2%
- Hiring Rate: 3.8%
Vermont
-
0.73
Vermont's Worker Shortage Index
- Job Openings: 13,000
- Unemployed Workers: 9,426
- Labor Force Participation Rate: 65.1%
- Unemployment Rate: 2.7%
- Quit Rate: 2.2%
- Hiring Rate: 3.8%
Virginia
-
0.69
Virginia's Worker Shortage Index
- Job Openings: 221,000
- Unemployed Workers: 151,942
- Labor Force Participation Rate: 65.4%
- Unemployment Rate: 3.3%
- Quit Rate: 2.1%
- Hiring Rate: 3.3%
Washington
-
1.28
Washington's Worker Shortage Index
- Job Openings: 140,000
- Unemployed Workers: 179,187
- Labor Force Participation Rate: 62.7%
- Unemployment Rate: 4.4%
- Quit Rate: 1.5%
- Hiring Rate: 3.0%
West Virginia
-
0.84
West Virginia's Worker Shortage Index
- Job Openings: 35,000
- Unemployed Workers: 29,441
- Labor Force Participation Rate: 54.3%
- Unemployment Rate: 3.8%
- Quit Rate: 2.5%
- Hiring Rate: 3.5%
Wisconsin
-
0.71
Wisconsin's Worker Shortage Index
- Job Openings: 146,000
- Unemployed Workers: 103,411
- Labor Force Participation Rate: 65.5%
- Unemployment Rate: 3.3%
- Quit Rate: 2.1%
- Hiring Rate: 3.5%
Wyoming
-
0.69
Wyoming's Worker Shortage Index
- Job Openings: 14,000
- Unemployed Workers: 9,714
- Labor Force Participation Rate: 62.5%
- Unemployment Rate: 3.3%
- Quit Rate: 2.7%
- Hiring Rate: 4.7%
Kentucky’s Labor Market
Before the pandemic, Kentucky's labor market faced challenges. The state’s unemployment rate of 4.1% was higher than the national rate, and its labor force participation rate stood five points below the national average. The state had 88 workers available for every 100 open jobs.
As of August 2023, Kentucky’s labor market has made strides towards recovery and is showing continuous signs of improvement. The state’s unemployment rate returned to pre-pandemic levels in December 2021 and has remained around this level.
On the downside, labor force participation has yet to fully recover, and unemployment still is above average. In addition, the state continues to face a worker shortage, evident by the fact that there are only 74 workers available for every 100 open jobs.
Kentucky’s Business Environment
Kentucky's business environment is diverse, encompassing five commercial airports and three global shipping hubs, multiple universities, and prominent manufacturing sites, in addition to a rapidly developing agricultural technology sector.

Among industries monitored by the Bureau of Labor Statistics, the trade, transportation, and utilities sector, as well as the government, employ the highest number of Kentuckians, while construction employs the fewest. Kentucky’s employment landscape is a result of a strong automotive, aerospace, and primary metal manufacturing presence, in addition to the state’s strategically favorable geographic location within 600 miles of 65% of the United States’ total population. The Bluegrass state also boasts multiple healthcare and energy firms that are prominent on the national level.

Kentucky maintains a thriving small business ecosystem, encompassing 99.3% of all Kentucky businesses. 43.3% of Kentucky’s workforce are employed by small businesses. Within this dynamic landscape, 40.6% of small businesses are women-owned, 7.9% are minority-owned, 3% are Hispanic-owned, and 7.5% are veteran-owned.
Kentucky’s Educational Attainment

As of 2022, 89% of Kentucky’s population has attained at least a high school diploma or its equivalent, on par with the national average. 27.9% of the population have earned a bachelor's degree, while 11.4% have completed a graduate degree, both below U.S. national averages.

Fortunately for employers, over 80% of Kentucky college freshmen are remaining in-state for their higher education, where the average tuition is $10,888.
Out-of-state tuition in the Bluegrass state is $26,048, which is slightly less expensive than the national average of $28,000. In total, over 265,000 students were enrolled in a Kentucky college for the 2022-2023 school year, supplying talent for local employers.
Quality of Life
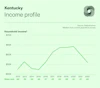
Kentucky's median household income is $55,880, below the national average of $70,000, placing it at 48th nationally. The state has a flat-rate tax system of 5%, meaning that all taxpayers pay at this bracket regardless of income level.
Twenty percent of Kentucky’s workforce work remotely at least one day a week. For those commuting into an office, the average commute time is 23.7 minutes. Kentucky's cost of living index, as measured by the Council for Community and Economic Research (with the national average set at 100), stands at 93.8. This means that the state is notably more affordable compared to the national cost of living. The median rent settles at $783 while the median home cost is $201,033, below national averages. In 2021, 67.8% of the population owned a housing unit, and the state experienced a .11% growth rate from April 2020 to 2022.
Immigration

In the U.S., immigrants tend to be of working age in comparison to native-born individuals. As workers, these immigrants are also contributing to support programs like Medicare and Social Security.
Looking at Kentucky in particular, immigrants comprise over four percent of the state's population, totaling over 188,000 individuals. Their collective spending power amounts to $4.5 billion, while their tax contributions reach $1.5 billion.
About the authors

Makinizi Hoover
Makinizi Hoover is the Senior Manager of Strategic Advocacy at the U.S. Chamber of Commerce. She leads the housing portfolio and mobilizes resources to address high-priority issues, ensuring effective advocacy on key legislative and regulatory priorities.
Stephanie Ferguson Melhorn
Stephanie Ferguson Melhorn is the Executive Director, Workforce and International Labor Policy. Her work on the labor shortage has been cited in the Wall Street Journal, Washington Post, and Associated Press.

Isabella Lucy
Isabella has created stunning visualizations tackling pressing issues like the worker shortage, the benefits of hiring veterans, the lifespan of small businesses, and the future of work.


