Makinizi Hoover Makinizi Hoover
Senior Manager, Strategic Advocacy, U.S. Chamber of Commerce
Stephanie Ferguson Stephanie Ferguson
Director, Global Employment Policy & Special Initiatives, U.S. Chamber of Commerce
Isabella Lucy Isabella Lucy
Graphic Designer, U.S. Chamber of Commerce

Published

November 03, 2023

Share

The state of North Carolina has a favorable landscape for businesses and individuals, with a diverse economy, continuing labor market recovery, and a robust small business ecosystem. Immigrants contribute meaningfully to the state's workforce and economy, while educational attainment, quality of life, and cost of living factors remain promising.  

The Worker Shortage Across America

Explore the interactive map below to see the impact of the worker shortage crisis in each state.

Least severe
Severe
More severe
Most severe

Alabama

  • 0.38
    Alabama's Worker Shortage Index
  • Job Openings: 129,000
  • Unemployed Workers: 48,590
  • Labor Force Participation Rate: 57.0%
  • Unemployment Rate: 2.1%
  • Quit Rate: 2.9%
  • Hiring Rate: 4.5%

Alaska

  • 0.59
    Alaska's Worker Shortage Index
  • Job Openings: 24,000
  • Unemployed Workers: 14,081
  • Labor Force Participation Rate: 65.2%
  • Unemployment Rate: 3.9%
  • Quit Rate: 3.4%
  • Hiring Rate: 4.9%

Arizona

  • 0.71
    Arizona's Worker Shortage Index
  • Job Openings: 199,000
  • Unemployed Workers: 141,617
  • Labor Force Participation Rate: 61.8%
  • Unemployment Rate: 3.8%
  • Quit Rate: 3.0%
  • Hiring Rate: 4.0%

Arkansas

  • 0.44
    Arkansas's Worker Shortage Index
  • Job Openings: 84,000
  • Unemployed Workers: 37,339
  • Labor Force Participation Rate: 57.7%
  • Unemployment Rate: 2.7%
  • Quit Rate: 2.7%
  • Hiring Rate: 4.3%

California

  • 0.92
    California's Worker Shortage Index
  • Job Openings: 975,000
  • Unemployed Workers: 895,044
  • Labor Force Participation Rate: 62.4%
  • Unemployment Rate: 4.6%
  • Quit Rate: 1.7%
  • Hiring Rate: 3.4%

Colorado

  • 0.52
    Colorado's Worker Shortage Index
  • Job Openings: 191,000
  • Unemployed Workers: 99,856
  • Labor Force Participation Rate: 68.7%
  • Unemployment Rate: 3.1%
  • Quit Rate: 2.3%
  • Hiring Rate: 3.0%

Connecticut

  • 0.74
    Connecticut's Worker Shortage Index
  • Job Openings: 91,000
  • Unemployed Workers: 67,253
  • Labor Force Participation Rate: 64.1%
  • Unemployment Rate: 3.5%
  • Quit Rate: 2.0%
  • Hiring Rate: 3.6%

Delaware

  • 0.63
    Delaware's Worker Shortage Index
  • Job Openings: 33,000
  • Unemployed Workers: 20,812
  • Labor Force Participation Rate: 60.3%
  • Unemployment Rate: 4.1%
  • Quit Rate: 3.1%
  • Hiring Rate: 5.4%

District of Columbia

  • 0.45
    District of Columbia's Worker Shortage Index
  • Job Openings: 43,000
  • Unemployed Workers: 19,519
  • Labor Force Participation Rate: 70.9%
  • Unemployment Rate: 5.0%
  • Quit Rate: 2.1%
  • Hiring Rate: 3.4%

Florida

  • 0.53
    Florida's Worker Shortage Index
  • Job Openings: 570,000
  • Unemployed Workers: 302,949
  • Labor Force Participation Rate: 59.7%
  • Unemployment Rate: 2.7%
  • Quit Rate: 2.8%
  • Hiring Rate: 4.0%

Georgia

  • 0.54
    Georgia's Worker Shortage Index
  • Job Openings: 323,000
  • Unemployed Workers: 174,106
  • Labor Force Participation Rate: 61.4%
  • Unemployment Rate: 3.3%
  • Quit Rate: 2.9%
  • Hiring Rate: 4.8%

Hawaii

  • 0.58
    Hawaii's Worker Shortage Index
  • Job Openings: 33,000
  • Unemployed Workers: 19,024
  • Labor Force Participation Rate: 60.2%
  • Unemployment Rate: 2.8%
  • Quit Rate: 1.9%
  • Hiring Rate: 3.3%

Idaho

  • 0.53
    Idaho's Worker Shortage Index
  • Job Openings: 55,000
  • Unemployed Workers: 28,947
  • Labor Force Participation Rate: 62.4%
  • Unemployment Rate: 3.0%
  • Quit Rate: 2.9%
  • Hiring Rate: 4.5%

Illinois

  • 0.76
    Illinois's Worker Shortage Index
  • Job Openings: 349,000
  • Unemployed Workers: 266,155
  • Labor Force Participation Rate: 64.4%
  • Unemployment Rate: 4.1%
  • Quit Rate: 1.8%
  • Hiring Rate: 3.4%

Indiana

  • 0.72
    Indiana's Worker Shortage Index
  • Job Openings: 162,000
  • Unemployed Workers: 117,400
  • Labor Force Participation Rate: 63.5%
  • Unemployment Rate: 3.4%
  • Quit Rate: 2.6%
  • Hiring Rate: 4.2%

Iowa

  • 0.67
    Iowa's Worker Shortage Index
  • Job Openings: 75,000
  • Unemployed Workers: 50,242
  • Labor Force Participation Rate: 68.7%
  • Unemployment Rate: 2.9%
  • Quit Rate: 2.4%
  • Hiring Rate: 3.3%

Kansas

  • 0.51
    Kansas's Worker Shortage Index
  • Job Openings: 82,000
  • Unemployed Workers: 41,743
  • Labor Force Participation Rate: 66.7%
  • Unemployment Rate: 2.7%
  • Quit Rate: 2.1%
  • Hiring Rate: 3.9%

Kentucky

  • 0.74
    Kentucky's Worker Shortage Index
  • Job Openings: 111,000
  • Unemployed Workers: 82,001
  • Labor Force Participation Rate: 57.6%
  • Unemployment Rate: 4.0%
  • Quit Rate: 2.9%
  • Hiring Rate: 4.1%

Louisiana

  • 0.55
    Louisiana's Worker Shortage Index
  • Job Openings: 126,000
  • Unemployed Workers: 68,804
  • Labor Force Participation Rate: 59.0%
  • Unemployment Rate: 3.3%
  • Quit Rate: 3.0%
  • Hiring Rate: 5.7%

Maine

  • 0.42
    Maine's Worker Shortage Index
  • Job Openings: 41,000
  • Unemployed Workers: 17,148
  • Labor Force Participation Rate: 58.6%
  • Unemployment Rate: 2.5%
  • Quit Rate: 1.7%
  • Hiring Rate: 3.6%

Maryland

  • 0.33
    Maryland's Worker Shortage Index
  • Job Openings: 165,000
  • Unemployed Workers: 54,778
  • Labor Force Participation Rate: 65.3%
  • Unemployment Rate: 1.7%
  • Quit Rate: 2.3%
  • Hiring Rate: 4.0%

Massachusetts

  • 0.42
    Massachusetts's Worker Shortage Index
  • Job Openings: 236,000
  • Unemployed Workers: 98,262
  • Labor Force Participation Rate: 64.5%
  • Unemployment Rate: 2.6%
  • Quit Rate: 1.3%
  • Hiring Rate: 3.2%

Michigan

  • 0.85
    Michigan's Worker Shortage Index
  • Job Openings: 216,000
  • Unemployed Workers: 183,249
  • Labor Force Participation Rate: 61.3%
  • Unemployment Rate: 3.7%
  • Quit Rate: 2.1%
  • Hiring Rate: 3.7%

Minnesota

  • 0.51
    Minnesota's Worker Shortage Index
  • Job Openings: 192,000
  • Unemployed Workers: 97,053
  • Labor Force Participation Rate: 68.5%
  • Unemployment Rate: 3.1%
  • Quit Rate: 2.3%
  • Hiring Rate: 3.5%

Mississippi

  • 0.49
    Mississippi's Worker Shortage Index
  • Job Openings: 80,000
  • Unemployed Workers: 39,159
  • Labor Force Participation Rate: 54.3%
  • Unemployment Rate: 3.2%
  • Quit Rate: 3.2%
  • Hiring Rate: 4.9%

Missouri

  • 0.53
    Missouri's Worker Shortage Index
  • Job Openings: 167,000
  • Unemployed Workers: 87,977
  • Labor Force Participation Rate: 63.7%
  • Unemployment Rate: 2.8%
  • Quit Rate: 2.2%
  • Hiring Rate: 3.3%

Montana

  • 0.42
    Montana's Worker Shortage Index
  • Job Openings: 35,000
  • Unemployed Workers: 14,691
  • Labor Force Participation Rate: 62.7%
  • Unemployment Rate: 2.5%
  • Quit Rate: 3.1%
  • Hiring Rate: 4.8%

Nebraska

  • 0.39
    Nebraska's Worker Shortage Index
  • Job Openings: 54,000
  • Unemployed Workers: 21,145
  • Labor Force Participation Rate: 69.2%
  • Unemployment Rate: 2.0%
  • Quit Rate: 2.3%
  • Hiring Rate: 3.6%

Nevada

  • 0.93
    Nevada's Worker Shortage Index
  • Job Openings: 92,000
  • Unemployed Workers: 85,620
  • Labor Force Participation Rate: 61.7%
  • Unemployment Rate: 5.4%
  • Quit Rate: 2.6%
  • Hiring Rate: 4.1%

New Hampshire

  • 0.28
    New Hampshire's Worker Shortage Index
  • Job Openings: 50,000
  • Unemployed Workers: 13,782
  • Labor Force Participation Rate: 64.6%
  • Unemployment Rate: 1.8%
  • Quit Rate: 2.1%
  • Hiring Rate: 4.2%

New Jersey

  • 0.84
    New Jersey's Worker Shortage Index
  • Job Openings: 243,000
  • Unemployed Workers: 203,340
  • Labor Force Participation Rate: 65.5%
  • Unemployment Rate: 4.2%
  • Quit Rate: 2.1%
  • Hiring Rate: 3.4%

New Mexico

  • 0.55
    New Mexico's Worker Shortage Index
  • Job Openings: 65,000
  • Unemployed Workers: 35,840
  • Labor Force Participation Rate: 57.2%
  • Unemployment Rate: 3.7%
  • Quit Rate: 2.4%
  • Hiring Rate: 4.5%

New York

  • 0.87
    New York's Worker Shortage Index
  • Job Openings: 441,000
  • Unemployed Workers: 384,655
  • Labor Force Participation Rate: 61.5%
  • Unemployment Rate: 3.9%
  • Quit Rate: 1.4%
  • Hiring Rate: 3.0%

North Carolina

  • 0.55
    North Carolina's Worker Shortage Index
  • Job Openings: 316,000
  • Unemployed Workers: 173,531
  • Labor Force Participation Rate: 60.8%
  • Unemployment Rate: 3.3%
  • Quit Rate: 2.7%
  • Hiring Rate: 3.7%

North Dakota

  • 0.30
    North Dakota's Worker Shortage Index
  • Job Openings: 26,000
  • Unemployed Workers: 7,890
  • Labor Force Participation Rate: 69.5%
  • Unemployment Rate: 1.9%
  • Quit Rate: 2.5%
  • Hiring Rate: 3.9%

Ohio

  • 0.62
    Ohio's Worker Shortage Index
  • Job Openings: 314,000
  • Unemployed Workers: 195,642
  • Labor Force Participation Rate: 62.1%
  • Unemployment Rate: 3.4%
  • Quit Rate: 2.4%
  • Hiring Rate: 3.4%

Oklahoma

  • 0.52
    Oklahoma's Worker Shortage Index
  • Job Openings: 104,000
  • Unemployed Workers: 54,368
  • Labor Force Participation Rate: 61.8%
  • Unemployment Rate: 2.8%
  • Quit Rate: 2.9%
  • Hiring Rate: 4.9%

Oregon

  • 0.66
    Oregon's Worker Shortage Index
  • Job Openings: 111,000
  • Unemployed Workers: 73,506
  • Labor Force Participation Rate: 61.7%
  • Unemployment Rate: 3.4%
  • Quit Rate: 2.3%
  • Hiring Rate: 3.5%

Pennsylvania

  • 0.66
    Pennsylvania's Worker Shortage Index
  • Job Openings: 342,000
  • Unemployed Workers: 226,208
  • Labor Force Participation Rate: 61.9%
  • Unemployment Rate: 3.5%
  • Quit Rate: 2.0%
  • Hiring Rate: 2.9%

Rhode Island

  • 0.53
    Rhode Island's Worker Shortage Index
  • Job Openings: 29,000
  • Unemployed Workers: 15,232
  • Labor Force Participation Rate: 63.3%
  • Unemployment Rate: 2.7%
  • Quit Rate: 1.8%
  • Hiring Rate: 3.9%

South Carolina

  • 0.43
    South Carolina's Worker Shortage Index
  • Job Openings: 168,000
  • Unemployed Workers: 73,016
  • Labor Force Participation Rate: 57.0%
  • Unemployment Rate: 3.0%
  • Quit Rate: 3.0%
  • Hiring Rate: 4.3%

South Dakota

  • 0.36
    South Dakota's Worker Shortage Index
  • Job Openings: 25,000
  • Unemployed Workers: 9,073
  • Labor Force Participation Rate: 67.8%
  • Unemployment Rate: 1.9%
  • Quit Rate: 2.6%
  • Hiring Rate: 3.9%

Tennessee

  • 0.56
    Tennessee's Worker Shortage Index
  • Job Openings: 189,000
  • Unemployed Workers: 105,102
  • Labor Force Participation Rate: 59.4%
  • Unemployment Rate: 3.1%
  • Quit Rate: 2.9%
  • Hiring Rate: 4.8%

Texas

  • 0.80
    Texas's Worker Shortage Index
  • Job Openings: 774,000
  • Unemployed Workers: 622,845
  • Labor Force Participation Rate: 64.2%
  • Unemployment Rate: 4.1%
  • Quit Rate: 2.7%
  • Hiring Rate: 3.8%

Utah

  • 0.44
    Utah's Worker Shortage Index
  • Job Openings: 105,000
  • Unemployed Workers: 45,772
  • Labor Force Participation Rate: 69.8%
  • Unemployment Rate: 2.5%
  • Quit Rate: 2.8%
  • Hiring Rate: 3.7%

Vermont

  • 0.36
    Vermont's Worker Shortage Index
  • Job Openings: 18,000
  • Unemployed Workers: 6,407
  • Labor Force Participation Rate: 64.0%
  • Unemployment Rate: 1.8%
  • Quit Rate: 2.3%
  • Hiring Rate: 3.6%

Virginia

  • 0.47
    Virginia's Worker Shortage Index
  • Job Openings: 243,000
  • Unemployed Workers: 113,102
  • Labor Force Participation Rate: 66.7%
  • Unemployment Rate: 2.5%
  • Quit Rate: 2.6%
  • Hiring Rate: 4.3%

Washington

  • 0.77
    Washington's Worker Shortage Index
  • Job Openings: 189,000
  • Unemployed Workers: 145,895
  • Labor Force Participation Rate: 64.6%
  • Unemployment Rate: 3.6%
  • Quit Rate: 2.2%
  • Hiring Rate: 3.4%

West Virginia

  • 0.54
    West Virginia's Worker Shortage Index
  • Job Openings: 52,000
  • Unemployed Workers: 28,256
  • Labor Force Participation Rate: 54.9%
  • Unemployment Rate: 3.6%
  • Quit Rate: 3.3%
  • Hiring Rate: 5.1%

Wisconsin

  • 0.54
    Wisconsin's Worker Shortage Index
  • Job Openings: 165,000
  • Unemployed Workers: 89,517
  • Labor Force Participation Rate: 65.7%
  • Unemployment Rate: 2.9%
  • Quit Rate: 2.3%
  • Hiring Rate: 3.3%

Wyoming

  • 0.46
    Wyoming's Worker Shortage Index
  • Job Openings: 19,000
  • Unemployed Workers: 8,739
  • Labor Force Participation Rate: 64.5%
  • Unemployment Rate: 2.9%
  • Quit Rate: 3.1%
  • Hiring Rate: 4.5%

The Chamber’s Worker Shortage Index ratio indicates the number of available workers for every job opening. A ratio above 1.0 indicates a surplus of available workers compared to job openings.  

North Carolina’s Labor Market

Before the pandemic, North Carolina's labor market faced some challenges. The state’s unemployment rate of 4% was higher than the national rate, and its labor force participation stood two points below the national average. The state had 82 workers for every 100 open jobs.

As of August 2023, North Carolina’s labor market has made significant strides to recovery and is showing continuous signs of improvement. The state’s unemployment rate has improved to 3.3%, lower than the national average of 3.8%, while the labor force participation rate is nearly at pre-pandemic levels.

On the downside, North Carolina’s labor force participation rate remains below the national average of 62.8%. The state also continues to face a worsening worker shortage with only 55 workers for every 100 open jobs.

North Carolina’s Business Environment

North Carolina’s business landscape is diverse and ever-growing, encompassing prominent research hubs, technology parks, innovation centers, and universities. The state is bountiful in natural resources, and energy-production facilities.

Among industries monitored by the Bureau of Labor Statistics, the trade, transportation, and utilities sector, in addition to the professional and business services industry, employ the highest number of individuals from North Carolina, while construction employs the fewest. North Carolina’s business landscape is powered by the state’s infrastructure, including its numerous ports and commercial airports. The state continues to be a hub for e-commerce and technology, in addition to the manufacturing and movement of goods.

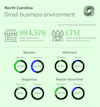
North Carolina features a thriving small business ecosystem, encompassing 99.6% of all businesses in the state. Over 44% of North Carolina's workforce is employed by small businesses. In this dynamic landscape, 44.3% of small businesses are women-owned, nearly 20% are minority-owned, 6.6% percent are Hispanic-owned, and 8.2% percent are veteran-owned.

North Carolina’s Educational Attainment

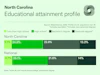
 In 2022, 90% of the North Carolina population obtained their high school diploma or its equivalent, around the national average. 35.9% of the population has attained a bachelor's degree, while 13.2% have secured a graduate degree, both within a percentage point of national rates.

Fortunately for employers in the state, most North Carolina college freshmen remain in the state for their higher education, where the average in-state tuition is $7,228.

Out-of-state tuition in the Tar Heel state is $23,357, which is less expensive than the national average out-of-state tuition of $28,000. Over 550,000 students are enrolled in a North Carolina college for the 2022-2023 school year, presenting a rich pool for local employers to recruit top-notch talent.

Quality of Life

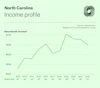
North Carolina's median household income of $65,070 is lower than the national average of around $70,000, placing the state as 42nd in the nation. North Carolina uses a flat-rate income tax system of 4.99%, meaning that individuals of all income brackets pay their taxes at this percentage.

Approximately a third of North Carolina’s workforce work remote at least one day a week. For those who commute to an office, the average commute time is 25 minutes. North Carolina's cost of living index, as measured by the Council for Community and Economic Research (with the national average set at 100), stands at 96.1. This means that the state is more affordable compared to the national cost of living. The median rent is $932, while the median home cost is $319,308, both falling beneath the national average. In 2021, 66% of the population owned their housing unit, and the state experienced a growth rate of 2.5% from 2020 to 2022. 

Immigration

In the U.S., immigrants tend to be of working age in comparison to native-born individuals. As workers, these immigrants are also contributing to support programs like Medicare and Social Security.

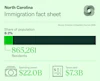
Looking at North Carolina in particular, immigrants comprise eight percent of the state's population, totaling over 860,000 individuals. Their collective spending power amounts to $22 billion, while their tax contributions surpass seven billion dollars. 

Explore More States

    About the authors

    Makinizi Hoover

    Makinizi Hoover

    Makinizi Hoover is the Senior Manager of Strategic Advocacy at the U.S. Chamber of Commerce. Her work includes the development and project management of comprehensive data centers that serve as a valuable resource for policymakers, businesses, and the public.

    Read more

    Stephanie Ferguson

    Stephanie Ferguson

    Stephanie Ferguson is the Director of Global Employment Policy & Special Initiatives. Her work on the labor shortage has been cited in the Wall Street Journal, Washington Post, and Associated Press.

    Read more

    Isabella Lucy

    Isabella Lucy

    Isabella has created stunning visualizations tackling pressing issues like the worker shortage, the benefits of hiring veterans, the lifespan of small businesses, and the future of work.

    Read more